
As one of the most-licensed and longest-tenured participants in the secondary and tertiary market for life insurance policies, Habersham Funding provides cash liquidity and scheduled benefit payments to consumers for all or a portion of their unwanted or unaffordable life insurance policies to fund personal needs that may include life and health care expenses.
Habersham has drawn on over 23 years of industry experience to develop and refine its Habersham Analytics platform and continues to work diligently to foster standardization in underwriting and valuation methods. Standardization and transparency in financial markets attract competitive investment capital that provides market liquidity. Market liquidity promotes an appropriate risk-adjusted cost of capital that results in a win-win for both consumers and investors. Sharing Habersham Investor Tools (“IT”) is an example of these market development initiatives.
IT is the user-friendly, foundational tool of the Habersham Analytics platform that allows investors to calculate a valuation using multiple pricing options and immediately review resulting displays of statistics based on probabilistic, deterministic, and stochastic methodologies.
Beginning May 1, 2013, investors approved by Habersham Funding will have free web-based access to IT.

IT allows you to pick a target internal rate of return (“IRR”) and, with a single click, calculate the corresponding purchase price based on probabilistic cash flows.
Or, if you have a purchase price in mind, you can enter it and, with one click, determine what your projected IRR would be using the same probabilistic cash flows.
If you prefer a deterministic valuation to probabilistic, we will be adding that ability to Investor Tools within weeks.
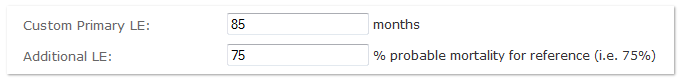
What if your view regarding the insured’s mortality differs from a Life Expectancy Provider’s projection (the “LE”)? No problem! IT allows you to value each policy using multiple LEs. Simply enter the LE value you want to use and click Calculate. IT will give you a target purchase price based on your desired discount rate, or the projected IRR for a target purchase price.
In addition to your custom LE value, to gain an additional point of reference you can also enter a probability percentage for an LE (for instance, the 75% probable LE) and IT will tell you what that probable LE is in months, as well as the projected premium you’ll have to pay up to that LE.
IT provides you with deterministic, probabilistic, and stochastic point-of-views so you can make an informed decision about your policy’s value.
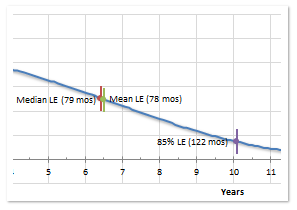
An insured has multiple life expectancies. IT’s “People Alive Out of 1,000” graph exhibits where an insured’s various life expectancies occur on a timeline. IT exhibits the insured’s Mean LE; Median LE; 85% Probable LE; the Break-Even or 100% Recovery LE (the LE where the total projected cash expenditures will equal any potential death benefit); and an additional probable LE of your choosing.
By reviewing the slope of this graph, you can understand the health projection of the insured. For instance, if the slope is gentle, that indicates the insured is projected to remain healthy for some time which may indicate a longer-term investment. If the slope is steep, the insured’s health is projected to decline more rapidly which may indicate a shorter-term investment.
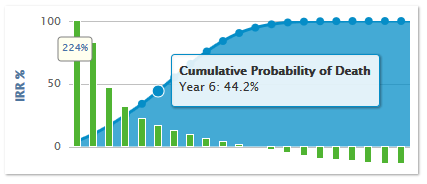
By reviewing IT’s “Deterministic” graph, you can understand what your IRR is projected to be should the insured live to the end of any successive annual projection period.
Behind the Deterministic IRRs you can see the cumulative probability of death for each successive year to have a better understanding of the probability of achieving each period’s respective IRR.
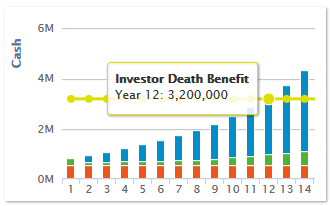
What are your cash flow expectations year-over-year?
IT’s “Deterministic Cash Flow” graph exhibits projected cash expenditures and how they compare to the potential death benefit in each successive period, allowing you to easily identify the “break-even” point when the projected expenditures will later exceed the potential death benefit.
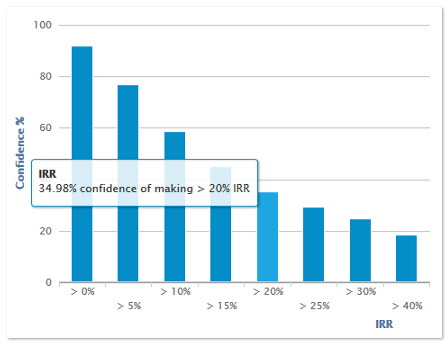
How much confidence do you have you'll achieve your target IRR?
IT’s “Stochastic” graph shows you the likelihood of achieving or surpassing increasing IRR thresholds. If you want to know what the probability is of achieving a target IRR for a policy, this graph will tell you!
With your inputs, our calculation engine, Habersham Analytics, is busy modeling thousands of potential cash flow scenarios for each policy so that IT can provide this information to you for your analysis.
Habersham Analytics has been reviewed and affirmed for its actuarial accuracy by a leading, international firm engaged in valuing secondary and tertiary life insurance assets.
As of May 1st, 2013, approved investors may gain access to Habersham Investor Tools, at no cost, through our file-sharing platform, Habersham Asset Management System.
No problem! You can optionally redact the necessary policy documentation and share it with Habersham Funding through our file-sharing platform. Our Analysts will enter the pertinent policy information into Habersham Analytics and give you full access to price your policy using all of IT’s features.
Contact us via email here.
For investor approval, contact us here.